A Majority of Students Rule Out
Colleges Based on Sticker Price
Students Do Not Take into Account Their Likely Financial Aid Award and Its Impact on Net Cost
Publisher’s Note
Implementation this year of the required Federal net price calculator and the many intensive efforts of colleges and universities to educate and inform students and families about the real costs of college appear to have been ignored or missed by a substantial portion of the college-bound population.In our latest studentPOLL study, conducted online in late December 2011 and January 2012 with college-bound high school seniors, slightly more than half of the 1,461 students surveyed reported that they had ruled out colleges on the basis of the sticker price alone without considering their likely financial aid awards. Worse yet, an even higher proportion of college-bound students from lower-income (under $60K) and middle-income ($60K to $100K) families — those in greatest need of financial aid — reported ruling out schools purely on the basis of the published sticker price.
In this issue of studentPOLL we revisit some of the questions posed to high school seniors in our 2009-2010 study. In a period of profound economic stress our goal was to better understand to what extent cost, financial aid, the economy, and other factors had influenced students’ consideration or choice of a college.
While optimists may see light at the end of the economic-recovery tunnel, the collective findings of this issue of studentPOLL continue to paint a bleak picture about college affordability and the willingness of families to try to pay for college in the face of difficult circumstances. In short, college affordability remains a profound challenge for a majority of students and their families.
Similar to the findings of the 2009-2010 study, only 7% of students reported that “My family can afford to send me to almost any college.” Another quarter indicated that “My family can afford to send me to most colleges, if we stretch a bit.” Yet roughly two-thirds indicated that paying for college will be a financial hardship. These data suggest that while the economy may be improving, the upturn has not had a positive impact on families’ perceived ability to pay for college.
To some extent, families and students are engaged in what appears to be naive or wishful thinking not only about how they will pay for college, but the kind and level of financial support they are likely to receive. Escalation of the merit scholarship arms race of recent years seems to have created a generation of students who approach the college admissions process with high, perhaps unrealistic expectations about their likelihood of receiving merit aid. In fact, merit aid appears to have become an expected entitlement. For example, studentPOLL asked students if they were more likely to receive financial aid from colleges based on family income, need, or their academic achievements. Almost three-quarters of these students indicated they would receive aid based on their academic achievements. And this was true across all levels of academic ability: a majority of students with the lowest SAT scores (less than 1110) expected to receive meritorious aid.
With the federal government’s mandate that colleges and universities develop and offer an online net price calculator (NPC) on their websites by the end of October 2011, these online tools have become universal since our last study. But student use of the NPCs lags far behind what it might be: Only 35 percent of the students we interviewed used a NPC as they considered their application decisions. To some degree, however, this may reflect the timing of our study. Some institutions may not have implemented NPCs until late October and use of NPCs may have been higher in early to late spring when students and their parents were making enrollment decisions. We may see very different findings when studentPOLL surveys students during the 2012 - 2013 admissions year. At the same time, findings from this cycle of studentPOLL research reveal that other sources of information on scholarships and paying for college (such as general information on college web sites and brochures about financial aid and scholarships) are more widely used by students than NPCs.
These and other findings in this issue of studentPOLL demonstrate that misperceptions about the actual cost of college are adversely affecting application and enrollment decisions. Clearly, the role of financial aid in reducing the cost of college is not well understood or not having a sufficient impact. And a pattern in nearly all of the findings documents the extent to which more needy students and families are adversely affected by a wide range of factors relating to price, aid, and affordability. For those concerned about access, this issue of studentPOLL raises another call to action.

Richard A. Hesel
Principal
Art & Science Group, LLC

David C. Meade, Jr.
Vice President for Enrollment
The College Board
Study Findings [top]
1.A majority of students applied to at least one college using Early Action or Early Decision, but a higher proportion of these students are from more affluent families.
studentPOLL asked students if they had applied to any schools through Early Action or Early Decision I or II programs. Slightly more than half (52%) applied through an early application process to at least one school.
Among notable subgroup findings:
- More affluent students from families with household incomes of greater than $100K were more likely to apply through an early application program compared to students from middle ($60K-$100K) and lower income families (those earning less than $60K). For example, 65% of students from high-income families had applied Early Action or Early Decision to “any” school compared to 49% of middle income and 42% of lower income students.
2. More than half of students and families are ruling out schools on the basis of the sticker price instead of net cost, failing to take into account what they would likely receive in financial aid.
To explore how families determine what college will cost and the price they can afford to pay, studentPOLL asked students if they had discussed college costs with their parents. While four out of five students indicated that they had done so, more than half also reported that they had ruled out colleges on the basis of their total cost or published sticker price without taking into consideration the financial aid award they would likely receive from any given college.
Students from lower- and middle-income families — those most likely to receive some form of need-based financial aid — were also more likely to rule out colleges on the basis of sticker price alone (58% and 62% respectively) compared to more affluent students (48%). Across populations, a majority of students are ruling out colleges on the basis of the sticker price alone. On the flip side, 41% of students with family incomes of $60K to $100K and 33% of students with incomes of less than $60K are considering the net cost of a school after subtracting what they might receive in financial aid.
3. An overwhelming majority of students plan to apply for financial aid to help pay for college.
When studentPOLL asked students whether they already have or plan to apply for financial aid to pay for college, most answered “yes,” across all income and academic ability levels. Of the nearly 1450 students surveyed in December and late January, 58% were planning to apply and 34% had applied for financial aid. Only 6% of students answered “no.”
By family income levels, the difference is statistically significant. For example, 98% of students with the lowest family incomes (less than $60K) compared to 95% of students with mid-range incomes ($60K to $100K) and 86% of students with the highest family incomes (more than $100K) indicated that they had or were planning to apply for financial aid to help pay for college.
4.A majority of students applying for aid expect to receive some form of merit support.
In our 2009-2010 study we found high percentages of students across academic ability levels who expected to receive financial aid based on their “academic, athletic or other achievements.” The current study echoes those findings.
For example, when we asked students if they thought they would more likely receive financial aid from colleges based on family income, need, or their academic, athletic or other achievements (accepting multiple responses), almost three-quarters of respondents (72%) indicated that they would receive aid based on their “academic achievements.” Around 22% indicated they would receive aid for other achievements (not based on academics), and about 9% indicated they would receive aid based on their athletic abilities.
Among notable subgroup findings:
- By SAT scores, 64% of students with the lowest combined math and verbal SAT scores (less than 1110) compared to 83% of those in the mid-range (1110 to 1290) and 90% of high-ability students (above 1300) indicated they would likely receive merit aid based on their academic achievements.
- By income, 80% of students with a family income of $60 to $100K and 84% of students with a family income over $100K were more likely to say they will receive aid based on their “academic achievements” compared to 63% of students from families with incomes under $60K.
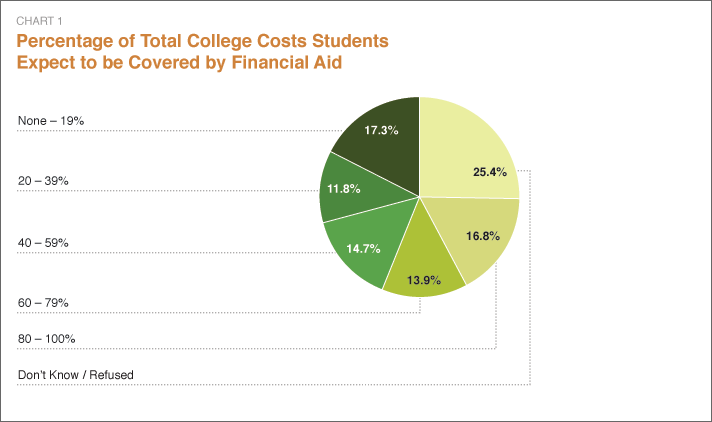
These data suggest that the merit scholarship arms race may very well have created a very strong and pervasive sense of entitlement on the part of the current generation of students, even among those with lesser academic ability as well as those with greater need. In fact, on average, students expect their financial aid award (excluding loans) to cover 50% of their college costs with students from lower income families expecting aid to cover an average of 64% of college costs compared to 52% of costs for middle income and 35% of college costs for students from the most affluent families.
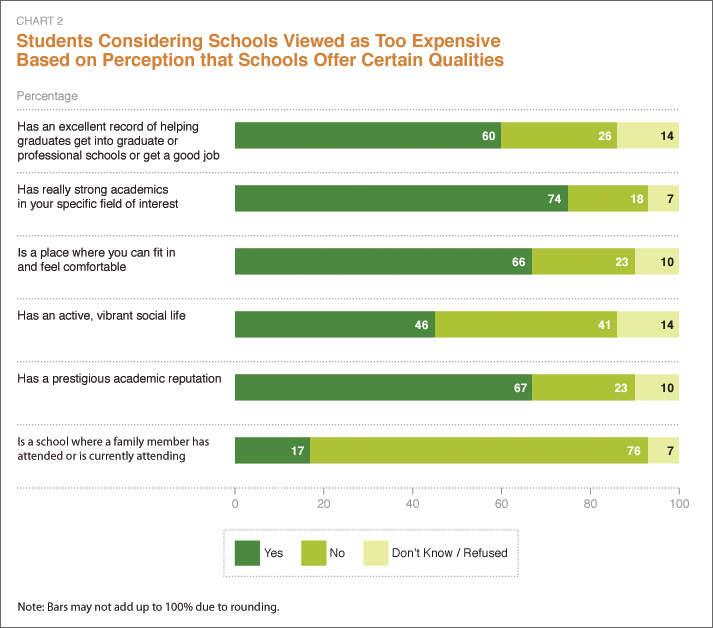
5.Students are willing to stretch financially for schools they consider too expensive because they offer certain highly valued qualities.
Similar to the findings in the 2009-2010 study, half to three-quarters of students are willing to stretch financially because they strongly value what certain schools offer.
For example, 74 percent of respondents indicated that they were considering a school they thought too expensive because it offered “strong academics in your specific field of interest.” About two-thirds of students were willing to stretch financially to attend a school that “is a place where you can fit in and feel comfortable” or one that had “a prestigious academic reputation.”
6.Student use of Net Tuition Price Calculators (NPCs) has significantly grown over the last two years, but not to the degree expected.
At the end of October 2011, the federal government required all post-secondary institutions receiving federal funding and enrolling first-time, full-time, degree-seeking students — including public, private nonprofit and for-profit schools — to post a net price calculator (NPC) on their websites. A net price calculator enables students and families to provide financial and personal information in order to determine what their expected annual net cost or financial aid award is likely to be from any given college.
Given the October 2011 compliance date, studentPOLL wanted to gauge to what extent students and their families were using these online tools to figure out what college will likely cost their family. Our study in 2010 — when not all institutions offered an online calculator — revealed, not surprisingly, that a very small number of students and parents were using calculators (9% in the early phase of college consideration and 16% in the later stages of the college decision process). This figure has climbed significantly over the last two years, but perhaps less than we might have expected given that NPCs are now universal.
In this study, studentPOLL found that 35% of students reported using “any” online financial aid calculator. Only 3.5% reported that their parents had used a calculator.
Given that more than 50 percent of students are ruling out colleges on the basis of sticker price alone, these findings suggest the need for colleges to more assertively encourage students and parents to use their net price calculators.
studentPOLL also asked students who reported that either they had or their parents had used NPCs (517 students), on a scale of 1 to 10 with 1 being very difficult and 10 being very easy, how they would rate the net price calculator on ease of use? We recognize there is wide variation in the depth and breadth of information students are asked to provide depending on the type of institution (e.g., public or private) and the nature of the net cost calculator they have created. But the good news is that a very small proportion of students — those giving the calculator a rating of 1-4 — reported finding it very difficult to use. Thirty-five percent of these students rated net price calculators they used as relatively easy to use (ratings of 8-10) with a mean rating of 6.7. Yet while NPCs are increasingly being used by students and generally are viewed as relatively easy to use, there is room for improvement.
For example, among students who rated the net price calculator difficult to use (rating it 5 or below on a 10-point scale (about 150 students), three-quarters of these respondents indicated the NPCs “require information I don’t have” and nearly half respectively reported that calculators “required too much information” or “take too much time” to complete.
For students who reported that they or their parents had used a NPC, studentPOLL then asked them how confident they were in the accuracy and reliability of the calculator. Slightly more than 60% of these students reported being “somewhat confident” and another quarter being “not very confident.” At the extremes, 7% indicated they were “very confident” in the accuracy and reliability of the NPC with only 3% indicating they were “not at all confident.” While there is a fairly high level of confidence among students in the accuracy of NPCs, encouraging greater use of the calculators among students and parents makes it critical for institutions to evaluate, refine, and simplify the information requested and the time it takes students and parents to complete the online net cost estimate.
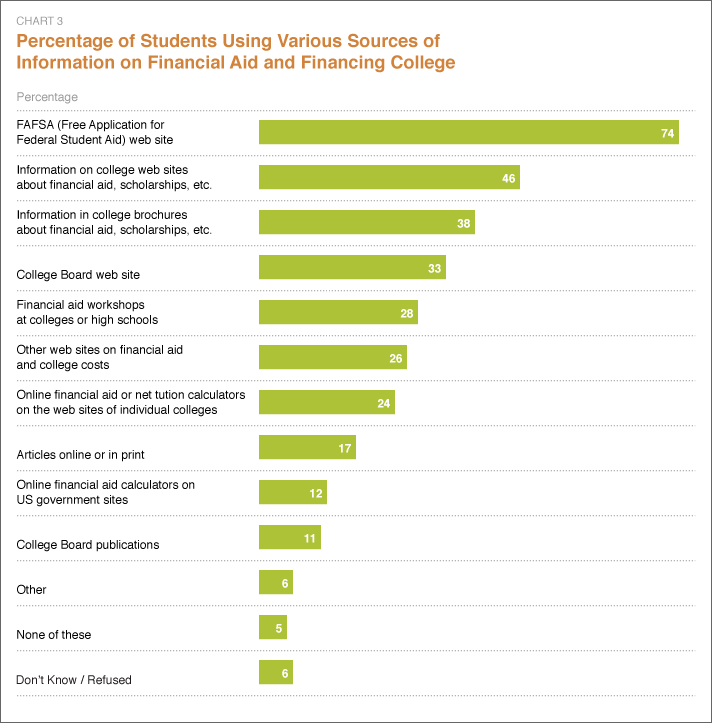
7.Other sources of information about financial aid and financing college are more widely used by students than net price calculators.
Given the wealth of information now available online and in printed publications to students and families about financing a college education and determining a family’s estimated family annual contribution for their child’s education, studentPOLL gave students a list of possible print and online resources they used to obtain information on financial aid and paying for college and accepted multiple responses. We also wanted to gauge the extent to which online net price calculators were being used relative to other available information sources.
While use of net price calculators is on the rise, their use is relatively modest compared to other college financing and financial aid sources. Not surprisingly since families applying for financial aid at most colleges are required to complete this form, nearly three-quarters of students reported using the FAFSA (Free Application for Federal Student Aid). Some 46% of respondents accessed information on college websites about financial aid and scholarships, and 38% obtained this information from brochures and print materials provided by colleges.
Only about one quarter of students indicated they used net price calculators provided on the websites of individual colleges and another 12% reported using calculators available on US government web sites.
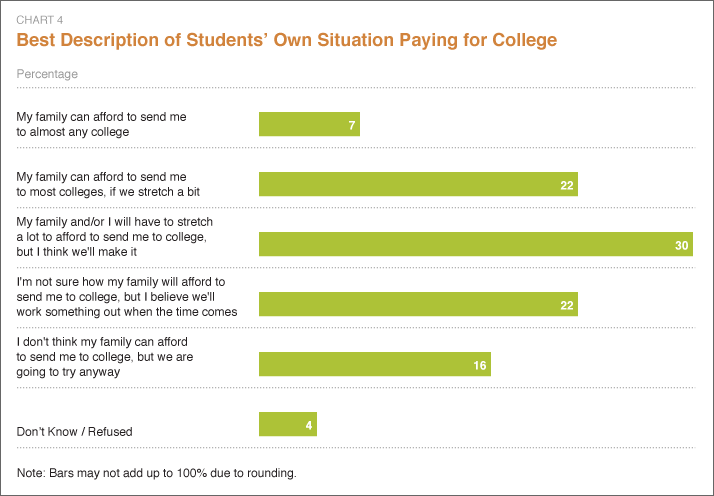
8.More than two-thirds of students surveyed will have some to extreme difficulty paying for college.
studentPOLL asked students a series of questions about their family’s ability to pay for college, asking them to indicate which statement most closely reflected their situation.
Our findings in this study, similar to our previous study, continue to paint a bleak picture about college affordability and the willingness of families to try to pay for college even in the face of insurmountable circumstances. College affordability, despite media reports of modest economic recovery, remains a growing challenge for students and their families across all income levels.
For example, only a very small portion of students (7%) reported that “My family can afford to send me to almost any college.” Another quarter indicated that “My family can afford to send me to most colleges, if we stretch a bit” while 67% indicated that paying for college will be a financial hardship to some degree.
At the same time, students and families remain engaged in what appears to be naive or incredibly wishful thinking, reporting that they believe “things will work out when the time comes” or that they “don’t think my family can afford to send me to college, but we’re going to try anyway.”
9.Most students report the cost of college has not influenced their choice of a major. Yet three-quarters plan to major in a field that will prepare them for a good job or career.
Given the rising costs of college, the challenging job market for new graduates, and the slow economic recovery, studentPOLL wanted to understand the extent to which these economic conditions were influencing students’ early decisions about the field or major they planned to pursue in college. We first asked students whether the cost of college had influence their choice of a major or field of study. To our surprise, 4 out of 5 students answered “no,” but that answer belies the reality.
We then asked students to read a series of statements about the effects of college costs on their choice of a major and select the statement that seemed to most accurately reflect their own situation. Over half indicated that they “intend to major in a field that will clearly help prepare me for a career after college or graduate school.” Slightly more than one fifth indicated that they “intend to major in a field that is career oriented and will provide me with the skills and experience to get a good job after I graduate.” Another one-fifth of respondents indicated that they “intend to major in a field that really interests me and I’ll worry about a job when I graduate.” Students seem concerned about their job prospects after college — a fact which was confirmed by another salient finding of the study.
When all students were asked how concerned they are about getting a good job when they graduate from college, 41% indicated they were “very concerned” and another 29% and 20% respectively reported being “somewhat concerned” or “slightly concerned” about their prospects of getting a good job after they graduate from college.
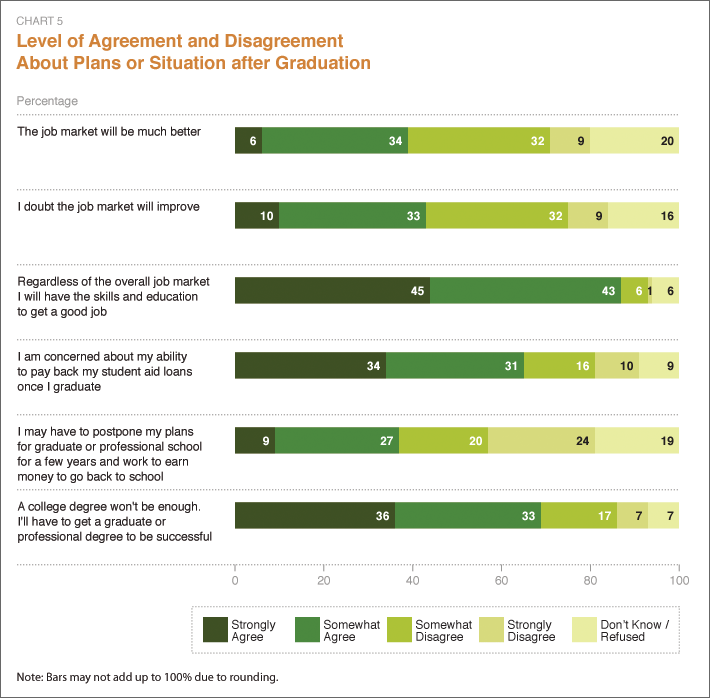
We next asked students to read a series of statements and asked them to indicate the extent to which they agreed or disagreed with each statement. Among the statements students most “strongly agreed” or “strongly disagreed” with:
- Regardless of the overall job market, I will have the skills and education to get a good job. (45% strongly agreed)
- A college degree won’t be enough. I’ll have to get a graduate or professional degree to be successful. (36% strongly agreed)
- I am concerned about my ability to pay back my student aid loans once I graduate. (34% strongly agreed)
- I may have to postpone my plans for graduate or professional school for a few years and work to earn money to go back to school (24% strongly disagreed) .
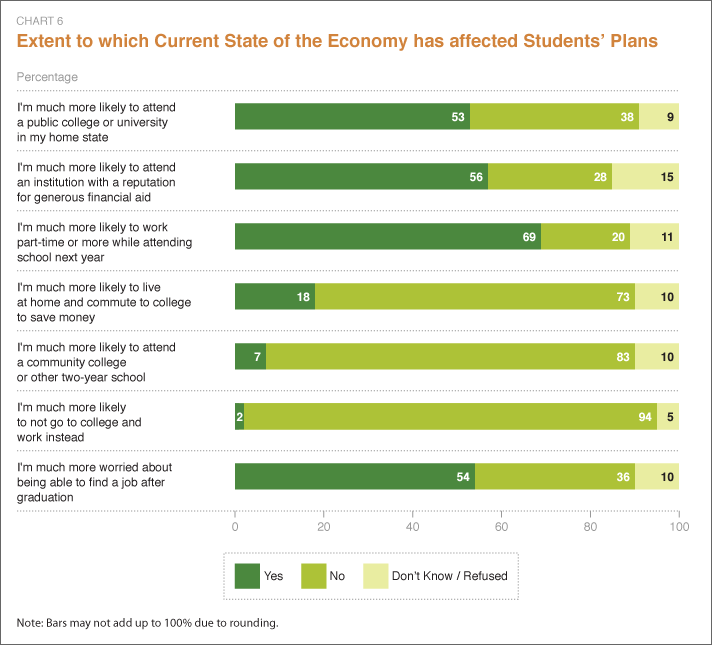
10.Despite signs of a modest economic recovery, the state of the economy has not brought about a dramatic change in students’ plans since our previous study.
Not much has changed over the course of two years, particularly regarding students’ college plans in light of the current state of the economy. About the same proportion of students, compared to the findings of our previous study, answered “yes” when asked how true the following statements were for them:
- I’m much more likely to attend a public college or university in my home state (53%).
- I’m much more likely to attend an institution with a reputation for generous financial aid (56%).
- I’m much more likely to work part-time or more while attending school next year (69%).
Despite students’ concerns about college costs and affordability, only a very small segment of students (7%) indicated that they are “much more likely to attend a community college or other 2-year school.”
11.A majority of students plan to work part-time or more while in college to help pay their college expenses.
A majority of students plan to work while attending college (59% of respondents). The mean number of hours they plan to work each week while attending college is 18.4 hours with 30% of these students reporting that they plan to work as much as 21 or more hours per week. By income subgroups the findings are even more revealing, illuminating the potential pressures lower and middle-income students face entering college to balance the demands and responsibilities of a challenging academic and work schedule in order to pay for college.
- Some 68% of students from lower income and 65% of those from middle-income families plan to work part-time or more compared to 47% of students from more affluent families.
- According to students from lower- and middle-income families, a sizable segment indicated that their parents expect them to pay for most of their college education (29% and 25% respectively compared to 10% of students from more affluent families).
studentPOLL also asked students to indicate the reasons why they plan to work while in college, accepting multiple responses. Ninety percent plan to work to “help pay for school expenses (i.e., tuition, room and board, fees, books, etc.)”, 70% to “have extra spending money, 47% to “pay for transportation costs to and from college,” and 28% to “pay for a car.” Reflecting some of the personal circumstances and difficulties students face, 18% indicated that they plan to work to “help support my family.”
Advisories [top]
- Based on our extensive experience with pricing studies, most students tend to over estimate an institution’s cost of attendance. That’s why it’s in the interest of your school to push the use of your online net price calculator and other information tools that give students an accurate estimate of their annual net cost once financial aid is taken into consideration. And it’s especially important for them to know the amount and types of grants and scholarships for which they’re qualified.
- Don’t hide your institution’s price information. If students have to drill down several levels on your web site to find specific information about your total cost of attendance and a breakdown of tuition, fees, and room and board, it makes them think you have something to hide. Make the information as simple and straightforward as possible (e.g., avoid credit hours, meal plan options, etc.) — just provide typical costs. Again, it’s in your interest to be transparent about cost information.
- Ultimately, the findings of studentPOLL reflect general trends across the broad college-going population in the U.S., and should not be interpreted as representative of the behavior of any one institution’s prospect pool. Each institution is unique, and only a careful examination of its own prospect pool can reveal how an institution can best maximize its net tuition revenue given its value proposition, its market position, the demographic makeup of its prospect pool, and many other factors.
Study Methodology [top]
The findings of this issue of studentPOLL were based on a random national sample of high school seniors who registered for the SAT and who completed an optional Web survey in early December 2011 or late January 2012. Some 1461 students completed the online survey. Specific demographic information about these respondents is provided in the table below:
| Gender | Region of the USA where student lives | SAT Score Distribution (Mean 1170) |
|---|---|---|
| Male: 43% Female: 57% |
Southern: 30% Mid-Atlantic: 25% Western: 18% Midwest: 14% New England: 11% Southwestern: 2% |
Low (< 1100): 39% Mid (1110 - 1290): 28% High (1300+): 34% |
| Annual Family Income (Mean $84,700) | Ethnicity | Intended Major |
| < $60K: 44% $60K - $100K: 25% $100K+: 31% |
Caucasian: 54% African American: 20% Latino / Hispanic: 18% Asian American / Pacific Islander: 9% |
STEM fields: 35% Pre-health: 15% Humanities & Social Sciences: 14% Business & Economics: 12% Arts: 7% Pre-Professional: 7% Education: 5% Don’t Know / Refused: 5% |
Respondents terminated from completing the online survey were those not planning to attend a four-year college or university or international students currently residing in the United States. The margin of sampling error for this student population is plus or minus 2.56 percent. The respondents are weighted to resemble the population of students’ based upon gender, race, and the region of the United States where they reside.
About studentPoll [top]
A collaboration between the College Board and Art & Science Group LLC, studentPOLL presents the results from a series of national surveys that measure the opinions, perceptions, and behavior of college-bound high school students and their parents. Published for the benefit of college and university senior leaders and enrollment officers as well as secondary school college counselors, studentPOLL seeks to provide insights and understanding that will result in better communication and service to college-bound students across the nation.
First published in 1995 by Art & Science Group, a leading national source of market intelligence for higher education, studentPOLL has become a trusted and widely-cited source of reliable data and insights on many critical questions concerning college choice. The College Board and Art & Science Group have now joined forces to expand the depth and range of the issues that will be explored in studentPOLL.
studentPOLL findings and analysis are provided free on both the College Board (http://www.collegeboard.org/studentpoll) and Art & Science Group (http://www.artsci.com/studentpoll/) web sites.
About the College Board and Art & Science Group [top]
The College Board is a mission-driven not-for-profit organization that connects students to college success and opportunity. Founded in 1900, the College Board was created to expand access to higher education. Today, the membership association is made up of over 6,000 of the world’s leading educational institutions and is dedicated to promoting excellence and equity in education. Each year, the College Board helps more than seven million students prepare for a successful transition to college through programs and services in college readiness and college success — including the SAT® and the Advanced Placement Program®. The organization also serves the education community through research and advocacy on behalf of students, educators and schools. For further information, visit www.collegeboard.org.
Art & Science Group (http://www.artsci.com/) is one of the nation’s most influential consulting firms specializing in market-related issues facing higher education and the nonprofit sector. The firm’s work synthesizes imagination and empirical rigor — art and science. Its research is considered the most rigorous and innovative in higher education today. The firm assists clients in every major arena of marketing and communications: market-informed strategic planning; enrollment management and student recruitment; development and alumni relations; tuition pricing and financial aid. The firm has extensive experience working with a large variety of public and private institutions of higher learning, ranging from comprehensive private and public research universities to small liberal arts colleges and professional and graduate schools.